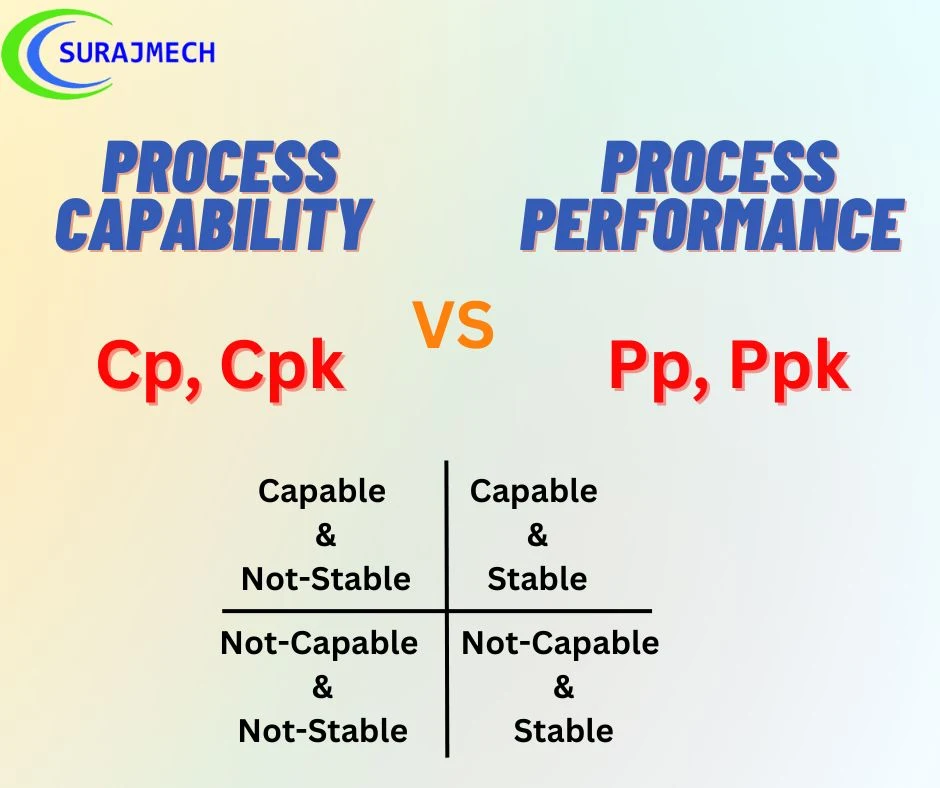
- Cp, Cpk, Pp and Ppk are important tools for measuring process capability.
- They can be used to identify processes that need improvement, to monitor the performance of processes over time, and to compare the performance of different processes.
- By using these tools, you can help to ensure that your processes are capable of producing outputs that meet your customer's requirements.
- They are all calculated using the same formula, but they differ in how they account for the centering of the process.
What is Cp, Cpk, Pp and Ppk?
Cp (Process Capability Index)
- Cp is a statistical measure that assesses the capability of a process to consistently produce products within specified tolerances.
- It evaluates the spread of data relative to the specification limits.
- Cp is calculated by dividing the tolerance width by six times the process standard deviation. In the Cp relationships, the standard deviation (σ) variable is to be "short term." Short term variability means average within the subgroup variability.
Importance of Cp
- Provides a numerical value to quantify process capability.
- Helps to identify if a process is capable of meeting customer requirements.
- Allows for easy comparison of different processes.
- Enables process improvement initiatives by identifying areas of improvement
Pp (Process Performance Index)
- Pp measures the potential capability of a process to meet specifications, but it does not account for process centering.
- Pp is calculated by dividing the tolerance width by six times the sample standard deviation.
- In the Pp relationships, the standard deviation (σ) variable is to be "long term." Total variability can be estimated from the entire data set.
Importance of Pp
- Provides a baseline assessment of process performance.
- Offers insights into the potential capability of the process without considering centering.
- Helps identify the potential variation range of the process.
A capable process
- The basic idea behind a capable process is very simple. You want your manufacturing process to be centered close to the nominal target value as designed and agreed upon by your customer
- If these conditions are met, you produce products that are (almost) perfect and have no waste as there is no single product off-spec.
Cpk (Process Capability Index with Centering)
- Cpk is an enhanced version of Cp that takes into account the process centering or alignment with the target value.
- It considers both the spread of data and the deviation from the target value.
- Cpk is calculated by taking the minimum of either the upper or lower Cpk value.
- In the Cpk relationships, the standard deviation (σ) variable is to be "short term." Short term variability means average within the subgroup variability.
Importance of Cpk
- Provides a more comprehensive evaluation of process capability by considering both spread and centering.
- Reflects how well the process is centered on the target value.
- Helps identify potential issues with process centering that could lead to increased variation or out-of-specification products.
Ppk (Process Performance Index with Centering)
- Ppk is similar to Cpk but focuses on process performance rather than capability.
- It considers both the spread of data and the deviation from the target value, like Cpk.
- Ppk is calculated by taking the minimum of either the upper or lower Ppk value.
- In the Ppk relationships, the standard deviation (σ) variable is to be "long term." Total variability can be estimated from the entire data set.
Importance of Ppk
- Reflects how well the process is performing in terms of both spread and centering.
- Provides a comprehensive view of process performance.
- Enables identification of potential issues affecting both variation and centering.
Centering and Spread
- Customers demand products that conform to their requirements.
- We want our processes to be as stable as possible, in order for our operation to be profitable.
- Let's visualize the meaning of the centering and spread so that its relevance gets crystal clear.
- A low spread alone is not enough as we see in the 3rd image of the diagram below. Although our process is very stable, we have many, many off-specs. This process will have a great Cp, but a dramatic Cpk.
- With a high spread, we produce garbage all the time. Regardless of our centering, we end up with lots of variation in our product quality and quite a number of off-specs as well. This process will have a similar Cp and Cpk, although quite low in absolute numbers.
- The best process is the 1st diagram, where we have a high centering and low spread. This is the holy grail we're all looking for! This process will have both a high Cp and Cpk.
Overall, Cp, Cpk, Pp, and Ppk are important statistical measures in quality management and process improvement. They help organizations assess and quantify the capability and performance of their processes. By understanding these indices and their advantages, businesses can identify areas for improvement, reduce variability, enhance customer satisfaction, and make data-driven decisions to achieve higher quality standards.


1 Comments
Truly inspiring and informative content! The way complex quality and manufacturing concepts are explained in simple terms shows real dedication. Keep sharing such valuable knowledge — it’s helping many engineers grow and learn every day. 👏🔥
ReplyDeletePost a Comment
Please do not enter any spam link in the comment box.