Control Chart Interpretation, Rules and Patterns
- This will help us to identify the special cause of variation from the process.
- By using this rule we can identify and eliminate the cause and make our process streamline.
- Control Chart in 7QC Tools check this article for complete understanding of control chart.
Zones in Control Chart
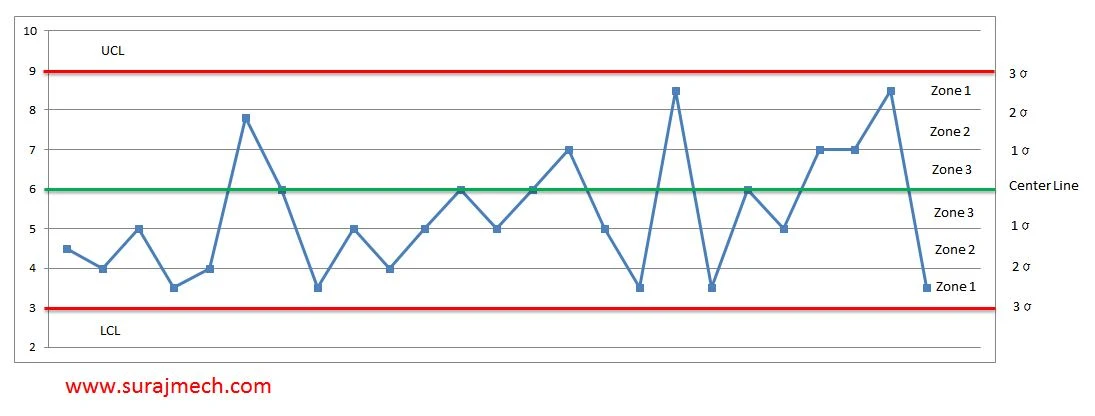
- There are total 6 zone. 3 from above center line and 3 are below from center line.
- One sigma is the distance between two zones.
- Please see the below picture for better understanding of Zones, UCL, LCL etc.
Eight Rules of Control Charts
1. One or more points beyond the control limits (UCL or LCL) (Either side)
2. 2 out of 3 consecutive points in Zone 1 or beyond (Either side).
3. 4 out of 5 consecutive points in Zone 2 or beyond (Either side).
4. 7 or more consecutive points on same side of the center line (Either side).
5. 7 consecutive points trending up or down.
6. 8 consecutive points with no points in Zone 3.
7. 15 consecutive points in Zone 3
8. 14 consecutive points alternating up and down.
1. One or more points beyond the control limits i.e. >3σ (UCL or LCL) (Either side)
- If any point beyond the UCL or LCL then special cause is available.
- Possible causes are - Wrong Setup, Measurement error, New operator, Power failure etc.
2. 2 out of 3 consecutive points in Zone 1 or beyond i.e. >2σ (Either side).
- This is also called as large shift from the average.
- If 2 out of 3 points present in Zone 1 or beyond then there is special cause available.
- Possible causes are - Wrong setup, Measurement Error, Power Failure, New Operator, Equipment breakdown.
3. 4 out of 5 consecutive points in Zone 2 or beyond i.e. >1σ (Either side).
- It is also called small shift from the average.
- If 4 out of 5 points present in Zone 2 or beyond then there is special cause available.
- Possible causes are - Change is work instruction, raw material change, Setup procedure change, Maintenance program change, Different shift, Person gain greater skill in doing job.
4. 7 or more consecutive points on same side of the center line (Either side).
- It is also called small shift from the average.
- If continuously 7 or more point fall on same side of center line then special cause present in the process.
- Possible causes are - Change is work instruction, raw material change, Setup procedure change, Maintenance program change, Different shift, Person gain greater skill in doing job.
5. 7 consecutive points trending up or down.
- It is called trend pattern.
- If 7 points are continuously in decreasing or increasing order then special cause is available in process.
- Possible causes are - Temperature (Cooling / Heating) Effect, Tooling Wear
6. 8 consecutive points with no points in Zone 3 i.e. 1σ.
- It is a mixture pattern.
- If 8 consecutive points are available in Zone 1 or 2 then special cause is available.
- Possible causes are - More than one process data mixed, mixed data of more than one machine or shift.
7. 15 consecutive points in Zone 3 i.e. 1σ
- This is called stratification pattern.
- If 15 consecutive point fall within Zone 3 then special cause is present in process.
- Possible causes are - More than one process data mixed, mixed data of more than one machine or shift.
8. 14 consecutive points alternating up and down.
- This is called over control pattern.
- If 14 consecutive points are up and down pattern then special cause is present in process.
- Possible causes are - Over adjustment, alternating raw material, Tempering by operator.
Summary
- Rule 1,2,3 and 4 are defined by Western Electric Co (1958) as the original 4 rules.
- It is not possible to list all special causes for each pattern,
- Some possible causes are mentioned below


1 Comments
Thank you!
ReplyDeletePost a Comment
Please do not enter any spam link in the comment box.