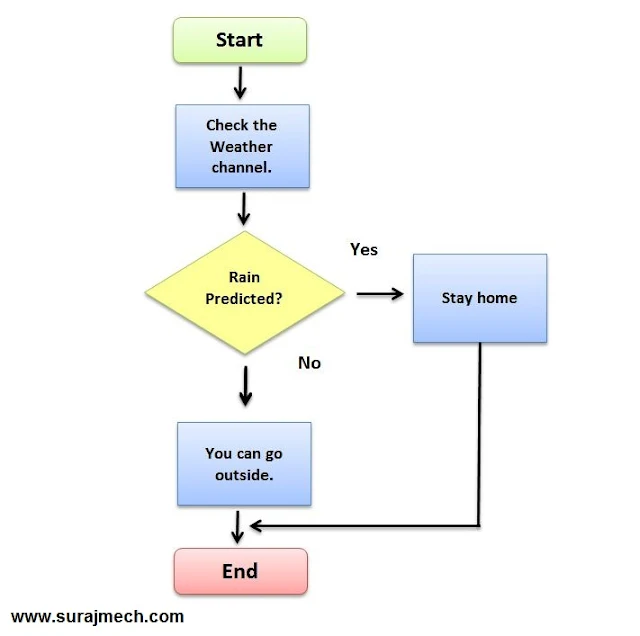
Flow Chart in 7QC Tools
- Flowchart is defined as a diagrammatic representation of an algorithm, a step-by-step approach to solving a task.
- Flow chart shows the steps as boxes of various kinds, and their order by connecting the boxes with arrows.
- Flow charts are used in designing and documenting simple processes or programs.
Use of Process Flow Diagram:
- Managing Workflow
- Documenting a process
- New project planning
- Audit purpose
History of Flow Diagram:
- In 1921, industrial engineers Flank and Lillian Gilbreth introduced the "Flow Process Chart" to the American Society of Mechanical Engineers (ASME).
- In 1947, ASME adopted a symbol system for Flow charts derived from the Gilbreths' original work.
- In 1960, The American National Symbols Institute (ANSI) set flow charts standards and their symbols.
- In 1970, International Organizations for Standardization adopted the ANSI symbols of flowcharts.
- In 1985, The current standards was revised.
Guideline for Flow Chart making:
- At the time of making a flow diagram, every stage should be listed in a logical order.
- In all process chart, start symbol only appears once, but end symbol can use more. Also all flow chart have at least one process box.
- There is only one arrow path graph for same path.
Flow chart Symbols:
1) Terminal (Oval)
- It is used for start and End activity of program.
- They usually contact the word "Start" or "End".
2) Arrow line
- Arrow line shows the process order of operation.
- Arrow line used to indicate line coming from one symbol and ending at other.
3) Diamond (Rhombus)
- Diamond is used for decision making purpose.
- The operation is commonly Yes/No question or True/False test.
4) Rectangle
5) Parallelogram
- Parallelogram indicates the process of input and output.
- It also used to display result
6) Single document graph
7) Multiple documents graph
8) Delay
Benefits of Flow Chart:
- Improve understanding of process
- Provide tool for training
- Identify problem areas and improvement opportunities.
- Define and analyze the process in an easy way.


Post a Comment
Post a Comment
Please do not enter any spam link in the comment box.